What Repeat Purchase Rate Tells You
Repeat purchase rate is the share of your customers who came back and bought again. It's the quickest read on whether your product earns a second order on its own.
It matters because a customer you've already won costs far less to sell to again. Harvard Business Review (October 2014) cites research by Frederick Reichheld of Bain & Company on this. A 5% rise in customer retention lifts profits by 25% to 95%.
The Repeat Purchase Rate Formula
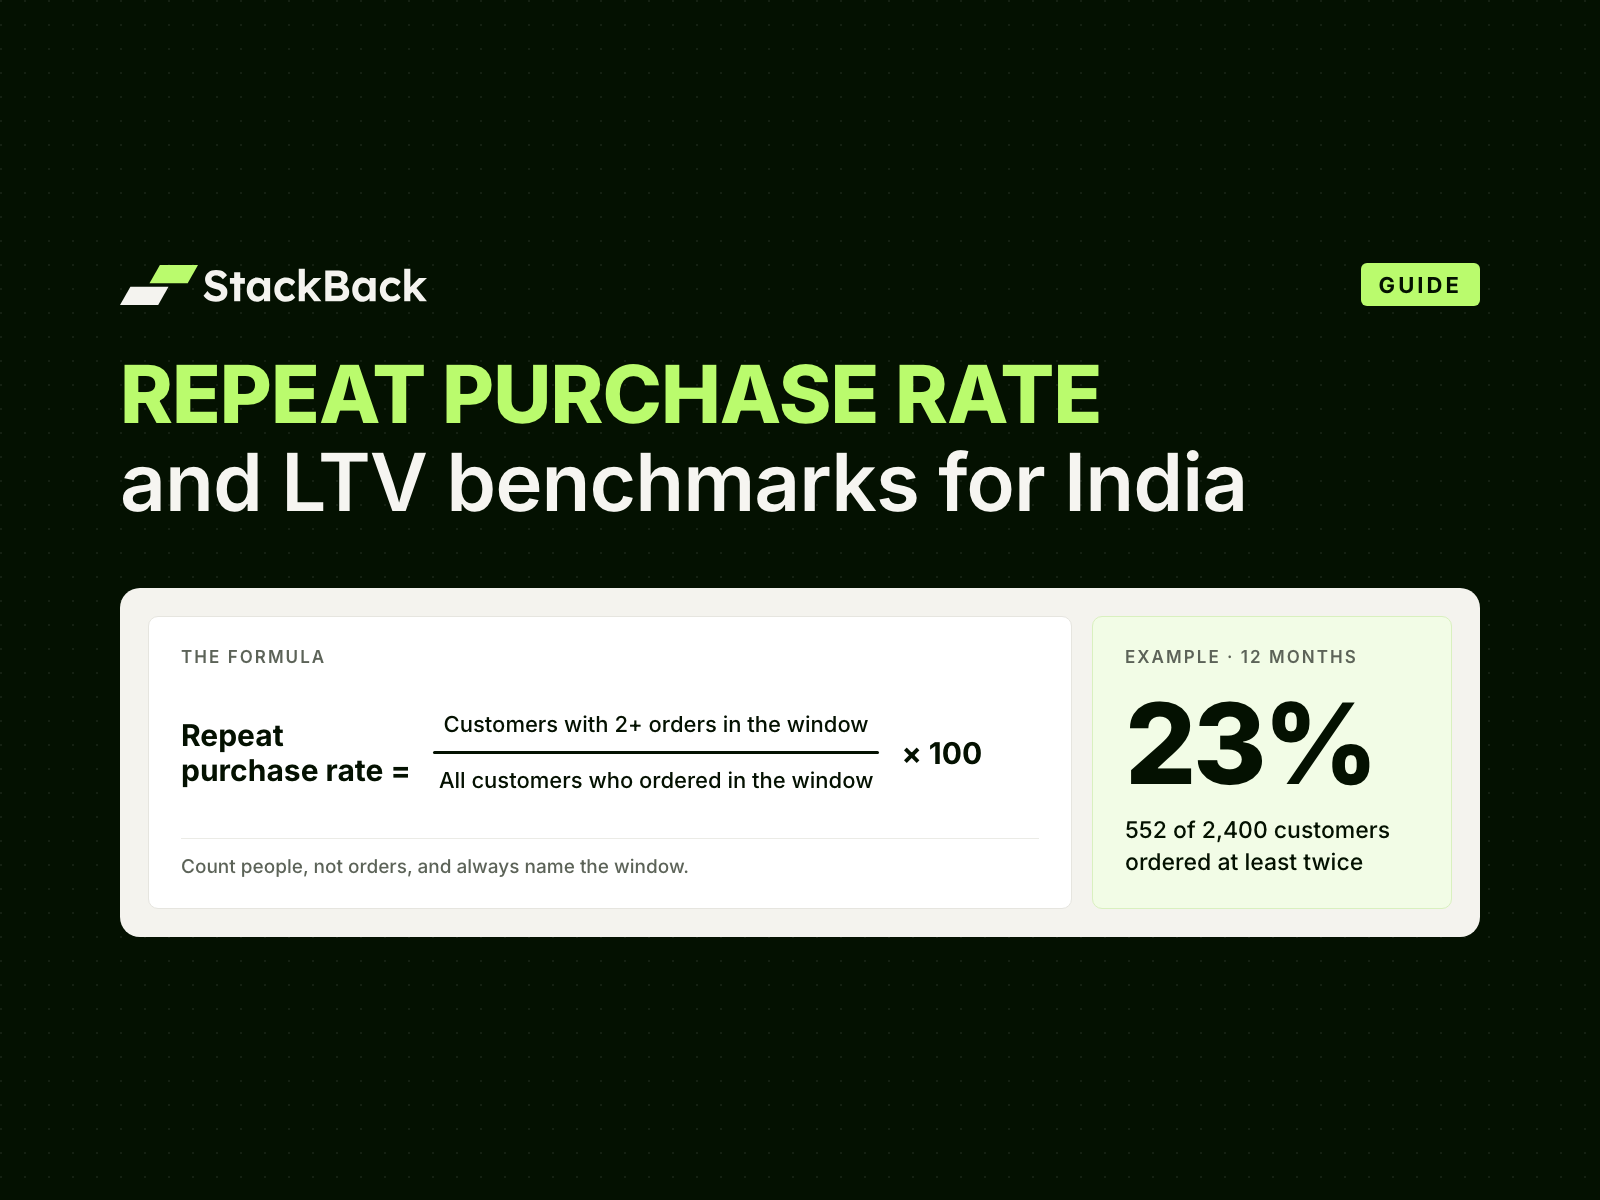
Repeat purchase rate = (customers with 2 or more orders in the window ÷ all customers who ordered in the window) × 100
Say 2,400 people ordered from your store in the last 12 months, and 552 of them ordered at least twice. Your 12-month repeat purchase rate is 552 ÷ 2,400 × 100 = 23%.
Three Rules That Keep the Number Honest
- Count people, not orders. A customer with five orders counts once. Merge duplicate profiles where one person used two emails or phone numbers.
- Name the window. A 90-day rate and a 12-month rate are different numbers. Pick one per report, and compare like with like.
- Leave out orders that never landed. Cancelled orders, full refunds and COD parcels refused at the door aren't purchases. Left in, they inflate both counts.
Repeat Purchase Rate, Returning Customer Rate and Retention Rate
Shopify reports two cousins of this metric, and they answer different questions.
- Returning customer rate is returning customers ÷ all customers who ordered in a period. Shopify counts a customer as returning when their order history already includes an order. It's a snapshot of who bought this month.
- Customer retention rate is the share of a cohort who placed an order in a given period. Shopify shows it in its Customer cohort analysis report.
- Repeat purchase rate follows one group of customers across a fixed window. Use it for benchmarks and goals.
A store can post a strong returning customer rate in a sale month while its repeat purchase rate falls. A small loyal group buys a lot, and most first-time buyers never come back.
How to Calculate LTV
Customer lifetime value (LTV) is what a customer is worth to you over a period, usually 12 months. Work it out three ways, because each answers a different question. The numbers below are samples.
1. Revenue LTV
Revenue LTV = average order value × orders per customer in 12 months
At an AOV of ₹850 and 1.6 orders per customer, revenue LTV is ₹1,360. It's quick, and it's what most dashboards show. It also flatters brands that discount heavily.
2. Margin LTV
Margin LTV = contribution per order × orders per customer in 12 months
Contribution is what's left of an order after the product, packing, shipping, payment fees and discounts. Say that's ₹850 − ₹280 − ₹90 − ₹25 = ₹455. Margin LTV is ₹455 × 1.6 = ₹728. Use this number for every decision about discounts and ad spend.
3. Subscriber LTV
Subscriber LTV = contribution per delivery × average deliveries per subscriber
Take average deliveries from your own subscriber history. For a monthly plan without much history, 1 ÷ monthly churn gives a rough count. At 10% monthly churn, that's about 10 deliveries. At ₹380 per delivery and 8 deliveries, subscriber LTV is ₹3,040.
LTV to CAC and Payback
Divide margin LTV by what it costs to win a customer (CAC). Shopify's guide to ecommerce metrics (September 2026) calls 3:1 the standard target, and notes that measured 2026 data sits well below it.
For a growing brand, payback matters as much: how many orders before a customer has covered their CAC. If CAC is ₹600 and each subscription delivery leaves ₹380, the subscriber pays you back at delivery 2. Across brands on StackBack, CAC payback on subscribers is under 1 month.
Read Retention With a Cohort Table
A cohort is every customer whose first order fell in the same month. A cohort table follows each group through the months after. It's the clearest view of whether retention is improving, because a big sale month can't hide in it.
Shopify builds one for you under Analytics › Reports › Customer cohort analysis. It groups customers by the date of their first order. You can switch the metric between customers, retention rate, sales and average order value.
| First order month | New customers | Month 1 | Month 2 | Month 3 | Month 6 |
|---|---|---|---|---|---|
| January | 820 | 14% | 10% | 9% | 6% |
| February | 760 | 15% | 11% | 9% | 7% |
| March (subscriptions launched) | 910 | 22% | 18% | 16% | — |
| April | 980 | 24% | 20% | — | — |
Sample numbers: the share of each month's new customers who ordered again in each later month.
- Read across a row to see how one group fades. A steep fall after month 1 means the second order isn't landing.
- Read down a column to see whether newer customers stay better than older ones. That's the line that should rise after a change, like launching subscriptions.
- Split subscribers from one-time buyers. Their curves look nothing alike, and averaging them hides both.
What Good Looks Like by Category
There's no public, India-wide benchmark for repeat purchase rate by category that we could verify. What does exist is one large global dataset, two Indian thresholds and Shopify's own comparison tool. Treat them as reference points, not targets.
A global dataset. Beauchamp Sullivan & Co., an e-commerce agency, analysed 156,110 customers across DTC brands (February 2026). Shopify cites it in its own metrics guide. It isn't India-specific. It found:
- 18.8% of customers placed a second order within 365 days.
- Consumables, such as supplements and food and beverage, typically ran at 30–40%, within a range of 22–44%.
- Fashion typically ran at 12–17%, and durables at 10–15%.
- Of the customers who came back, half did so within 30 days, and 76% within 90 days.
- 77% of second purchases were the same product again.
Those last two numbers matter for subscriptions. Most second orders are the same product, bought soon after the first. That's a subscription the customer hasn't been offered yet.
Two Indian thresholds. Unicommerce's India D2C report (April 2026) draws on 410 million shipments from 6,000+ brands. It warns that a 90-day repeat rate below 20% means you're running paid traffic to a leaky bucket. Forbes India (February 2026) wrote that the D2C brands that last will need repeat purchase rates above 35–40%. Both are thresholds, not measured averages.
Shopify Benchmarks. Shopify's analytics can compare your store with similar stores on several metrics, if your store is eligible (Shopify Changelog, June 2025).
StackBack's own numbers. Across brands on StackBack, average LTV expansion is 3.15×. MillD runs monthly AutoPay subscriptions at 33% off and has seen a 4.2× LTV expansion. The Stack runs prepaid plans at 35% off (4.8×), and Rosier Foods runs prepaid and pay-as-you-go plans at 25% off (3×). Each figure compares a subscriber's 12-month LTV with a one-time buyer's.
What to Measure When There's No Benchmark
Set the window by how long your product lasts. Measure repeat purchases at about one and a half to two times the use-up time, so a slow customer still counts. Measure your hero product on its own, because one store-wide rate mixes fast and slow products.
| Category | Typical reorder rhythm | Measure repeat within |
|---|---|---|
| Milk and dairy | Weekly | 30 days |
| Coffee and tea | Every 2–4 weeks | 60 days |
| Atta, rice and staples | Every 3–4 weeks | 60 days |
| Diapers and baby care | Every 2–4 weeks | 60 days |
| Protein and supplements | Monthly | 60–90 days |
| Pet food | Every 4–6 weeks | 90 days |
| Skincare and haircare | Every 6–8 weeks | 120 days |
Rhythms are typical use-up times; check them against your own pack sizes.
Then track three numbers for each hero product, every month:
- Repeat purchase rate within its window.
- Median days to the second order.
- The share of second orders that are the same product.
If the median gap sits close to the use-up time, customers are already reordering on a rhythm. That rhythm is your subscription cadence.
See What Subscriptions Could Do to Your Repeat Rate
On StackBack, a subscriber's 12-month LTV averages 3.15× a one-time buyer's. Bring your Shopify numbers and we'll walk through yours.
How to Raise Your Repeat Purchase Rate
- Time reorder reminders to the use-up date, not to a fixed number of days after delivery.
- Offer a subscription at the second order. That's when a customer has shown they reorder. Our first 100 subscribers playbook shows who to invite and how.
- Give each customer a way to pay that suits them: prepaid, pay-as-you-go or AutoPay on UPI and cards. See AutoPay vs prepaid vs pay-as-you-go.
- Price the discount so it pays for itself. See subscription discounts and pricing.
- Let subscribers change their plan instead of leaving: skip, pause, swap or change frequency. More in reducing subscription churn.
How StackBack Handles This
StackBack is the subscription & repeat-revenue platform for Indian D2C brands on Shopify. Brands run prepaid, pay-as-you-go and AutoPay on UPI and cards side by side, plus every type of bundle and a customer portal. Each subscription order appears in Shopify once that delivery is due and paid, tagged Subscription. So your Shopify order filters and exports can separate subscribers from one-time buyers.
Over 100 brands use StackBack, with ₹90 Cr+ in GMV powered. You integrate StackBack with your Shopify store, our team sets up your plans, and we take you live in 2 days. See how subscriptions work on StackBack.
Frequently Asked Questions
What is the repeat purchase rate formula?
Repeat purchase rate = customers with two or more orders in a window ÷ all customers who ordered in that window × 100. If 552 of 2,400 customers ordered twice or more in 12 months, the rate is 23%.
What is a good repeat purchase rate for a D2C brand in India?
It depends on what you sell and the window you measure. In a February 2026 global analysis by Beauchamp Sullivan & Co., consumable DTC brands typically saw 30–40% of customers order again within a year. In India, Unicommerce flags a 90-day rate below 20% as a warning sign. Compare yourself with your own past cohorts first.
What's the difference between repeat purchase rate and customer retention rate?
Repeat purchase rate follows one group over a window and asks who bought twice or more. Customer retention rate, as Shopify reports it, is the share of a first-order cohort who ordered in a given later period.
How do I calculate customer lifetime value?
Multiply contribution per order by orders per customer over 12 months. For subscribers, multiply contribution per delivery by average deliveries per subscriber. Use margin, not revenue, for decisions.
What is a good LTV to CAC ratio?
Shopify's metrics guide calls 3:1 the standard target. For a growing brand, payback matters as much: how many orders before a customer covers what it cost to win them.
Where do I find these numbers in Shopify?
Under Analytics › Reports. The Customer cohort analysis report shows retention by first-order month. The Returning customers report lists everyone with two or more orders. Shopify Benchmarks compares eligible stores with similar stores.
Turn Second Orders Into Subscriptions
Prepaid, pay-as-you-go and AutoPay on UPI and cards on your Shopify store, with every subscription order tagged in Shopify. Our team takes you live in 2 days.
Sources: Shopify Help Center, Customers reports and Analytics fields, checked 15 Oct 2026 · Shopify Changelog, benchmarks and customer cohort analysis, 27 Jun 2025 · Shopify Blog, "25 Key Ecommerce Metrics to Track in 2026", 13 Sep 2026 · Beauchamp Sullivan & Co., "Repeat Purchase Rate Benchmarks: 18.8% Across 156K Customers", 14 Feb 2026 (cited by name) · Unicommerce, India D2C Report, April 2026 (cited by name) · Forbes India, "India's D2C journey: After a rapid scale-up, why it's now all about discipline", 27 Feb 2026 · Harvard Business Review, "The Value of Keeping the Right Customers", 29 Oct 2014